Sign In
Welcome! Sign In to personalize your Cat.com experience
If you already have an existing account with another Cat App, you can use the same account to sign in here
Register Now
One Account. All of Cat.
Your Caterpillar account is the single account you use to log in to select services and applications we offer. Shop for parts and machines online, manage your fleet, go mobile, and more.
Account Information
Site Settings
Security

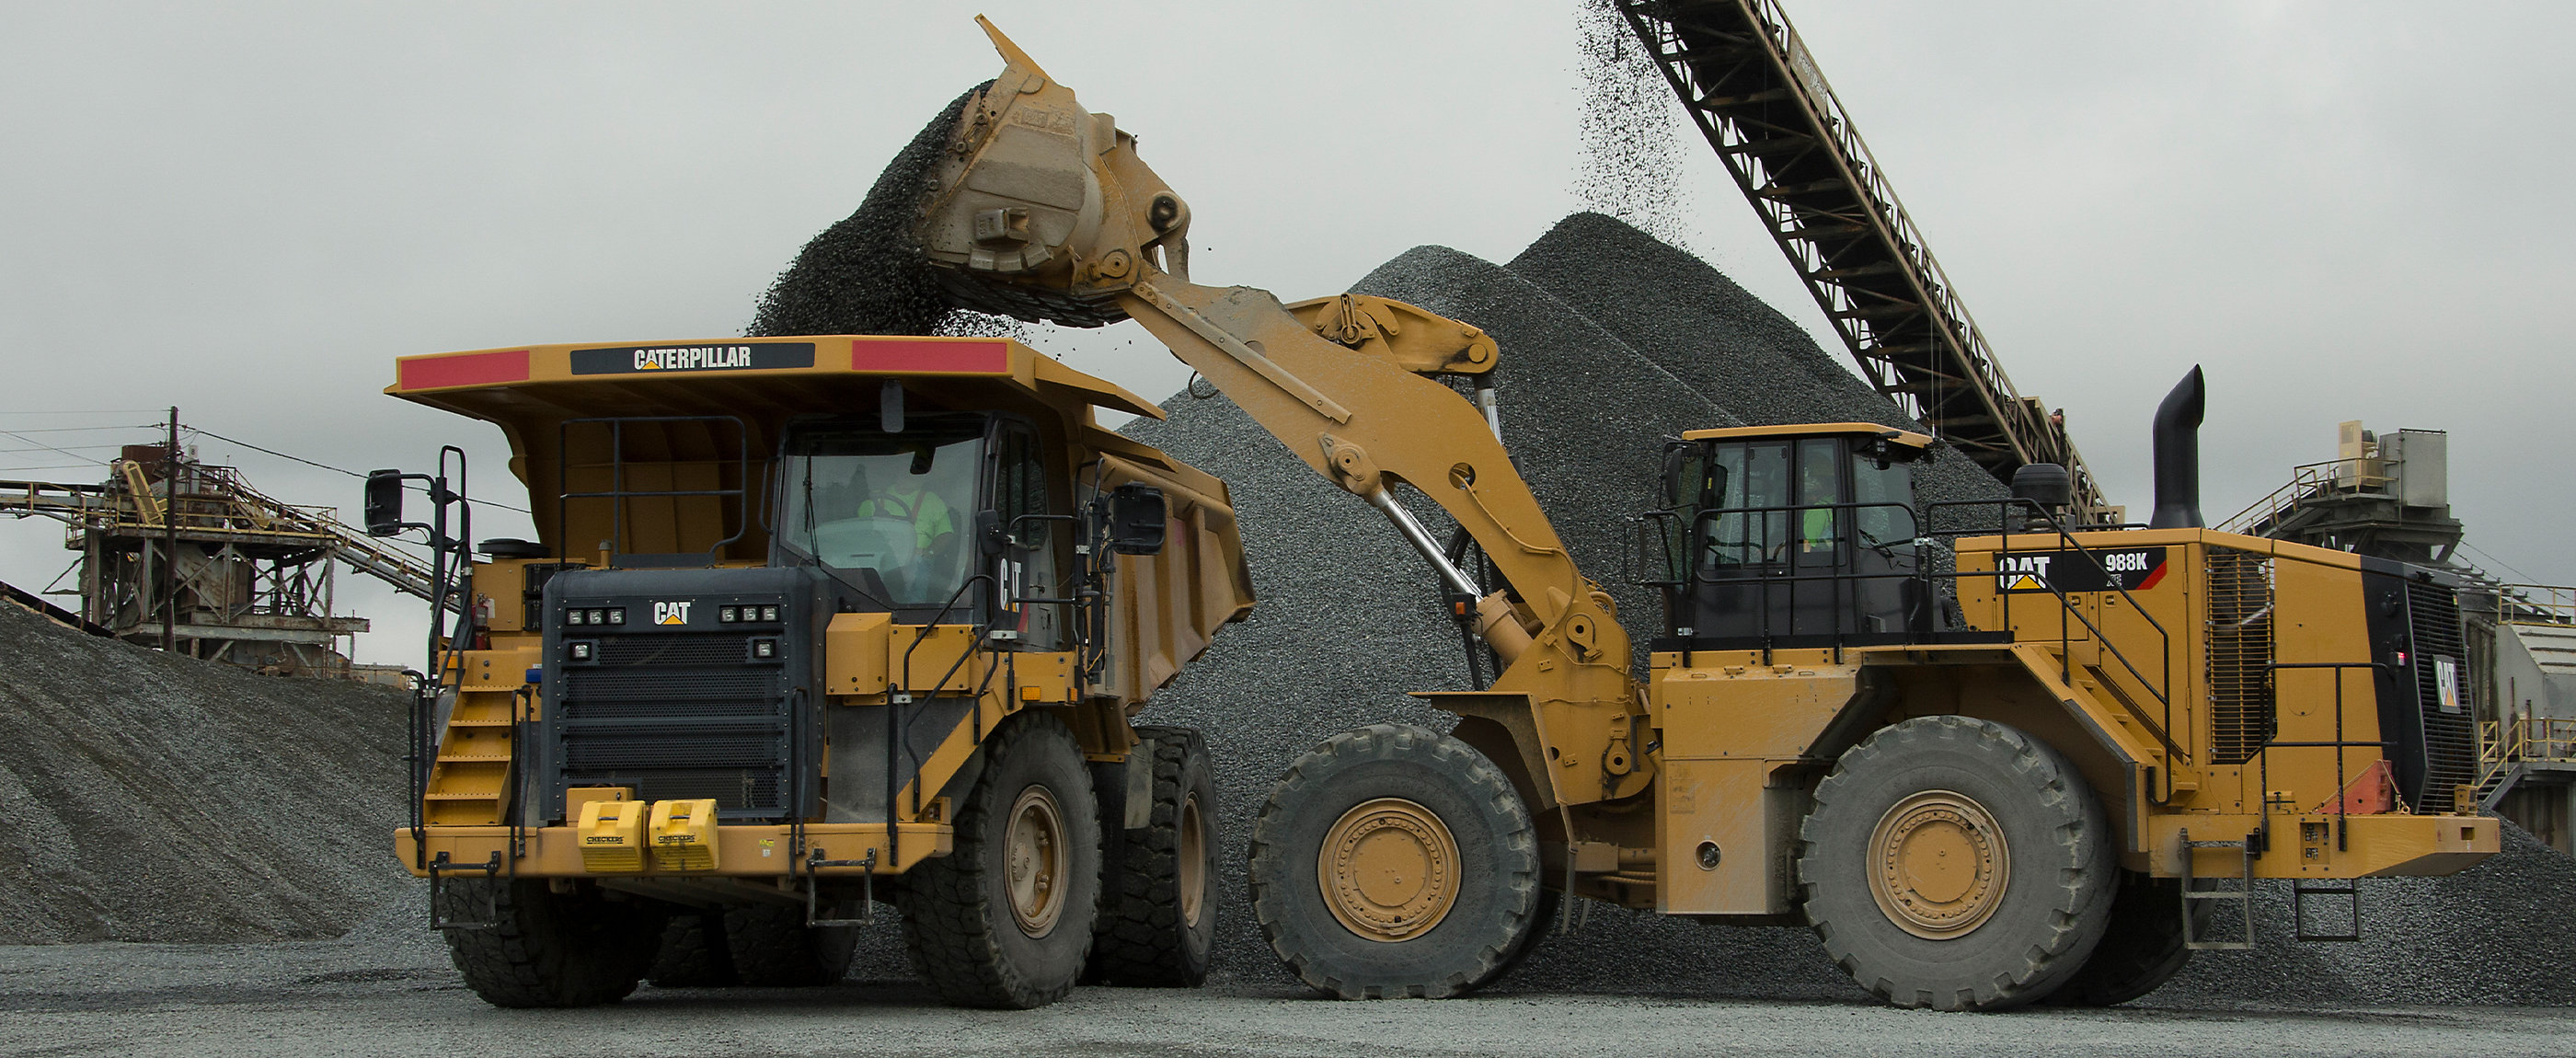
Cat® Site Evaluation
Success Story
When a Cat® customer needed fuel management help on their quarry site, a Cat Site Evaluation helped them use less fuel and increase productivity, saving more than $230,000 per year.
Fuel expense represents about 30%-50% of total machine operating costs in the quarry business, making it a key target for cost reduction — but because many factors influence fuel consumption, reducing it can be a real challenge for customers. These factors include six key "fuel influencers."
- Idling management
- Operator technique
- Jobsite setup and maintenance
- Equipment selection and configuration
- Fuel monitoring and fuel saving technology
- Fuel quality
One large quarry customer wanted help evaluating the impact of these influencers on their fuel efficiency and costs, so they reached out to their local Cat dealer. With their dealer's help, they kicked off a Level 3 Site Evaluation. The team from Caterpillar measured, recorded and documented operating data to determine fuel consumption impacts, as well as fuel efficiency for the payload fleets, production support fleets and ranch fleets.
After the initial evaluation, the customer implemented fuel-focused recommendations, such as enabling on-board features like auto-idle, utilizing Engine Idle Management Systems and diligent production management best practices. They also right-sized their fleet, adding 11 machines to better match their production targets. The result? One year later, the customer reported 6% less idle time and more than $92,000 in fuel savings, a total savings of more than $230,000.
Here's a deeper look at their results — from baseline to the savings they reported a year later.
KEY METRICS - PAYLOAD PRODUCTION FLEET
| Hours | Gallon/Hour | Tons | Ton/Hour | Tons/Gallon | Dollars | |
| Baseline | 2,714 | 8.0 | 508,547 | 187 | 24 | $32,611 |
| Mid Year | 2,278 | 10.1 | 848,521 | 372 | 37 | $34,680 |
| Year End | 2,682 | 9.5 | 925,624 | 245 | 40 | $38,645 |
Payload Production Summary
| METRIC | BASELINE | MID-YEAR | YEAR END | DELTA % |
| Fuel Consumption (gallons per month) | 21,597 | 22,967 | 25,593 | 19% |
| Operating Hours (hours per month) | 2,714 | 2,278 | 2,682 | -1% |
| Fuel Consumption (gallons per hour) | 8.0 | 10.1 | 9.5 | 19% |
| Production (tons per month) | 508,547 | 848,521 | 925,624 | 82% |
| Production (tons per hour) | 187 | 372 | 346 | 85% |
| Fuel Efficiency (tons per gallon) | 24 | 37 | 40 | 67% |
| Idle Time (hours per month) | 488 | 249 | 329 | -33% |
| Idle Time (%) | 18 | 11 | 12 | -33% |
| Fuel Expense ($ per month) | $32,611 | $34,680 | $38,645 | 19% |
| Greenhouse Gas Emissions (CO2 Tons) | 243 | 217 | 288 | 19% |
Fuel Savings Summary
| CHANGE IMPACT FACTOR | PER UNIT | AVE. MID-YEAR | AVE. YEAR END |
| Eco Mode – Wheel Loader (gallon per hour) | 1.0 GPH | $15,656 | $43,150 |
| Tire Pressures – Articulated Trucks & Wheel Loaders (gallon per hour) | 0.9 GPH | $9,031 | $27,838 |
| System Training – Excavator & Articulated Trucks (gallon per hour) | 0.5 GPH | $4,587 | $21,637 |
| TOTAL FUEL SAVINGS | $29,274 | $92,625 |
Looking for deep insights on your operation? Contact your dealer and request a Site Evaluation today.
RELATED ARTICLES
You’re here to get ideas to grow your business. Read on for machine insights and expert tips and tricks to get more out of every job.
-
Productivity - More Efficiency. Better Results.
Cat® Technologies gives you the accuracy, consistency and productivity you want.
Learn More -
How to Use Drones on Construction Job Sites
You can use drones in construction for a wide variety of things, and with the right planning and drone program can give your business detailed, accurate, and real-time information on your site’s progress. This is information you can put to use to improve the quality, accuracy, and efficiency on the job.
Learn More -
Automation & Autonomy: What's the Difference?
These words get used interchangeably, creating confusion. To improve consistency, we've defined these terms.
Learn More -
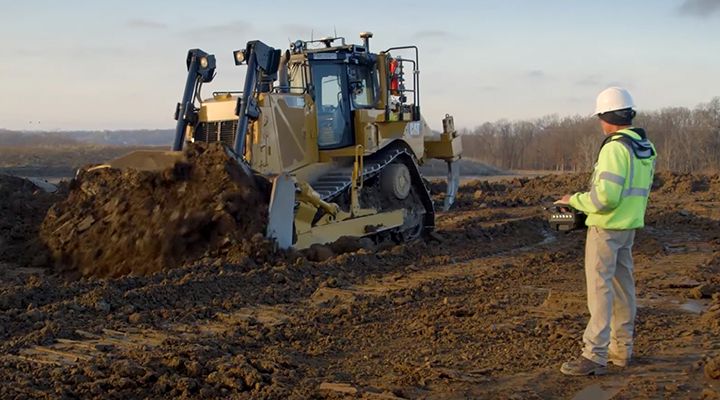
Machine Control & Automation Can Add To Your Bottom Line
Technologies that enhance machine performance can add to the bottom line.
Learn More