Sign In
Welcome! Sign In to personalize your Cat.com experience
If you already have an existing account with another Cat App, you can use the same account to sign in here
Register Now
One Account. All of Cat.
Your Caterpillar account is the single account you use to log in to select services and applications we offer. Shop for parts and machines online, manage your fleet, go mobile, and more.
Account Information
Site Settings
Security
Supporting the Grid: How Utilities Reduce Costs and Boost Efficiency with Gas
January 16, 2024
Low natural gas prices make gas-fueled distributed generation even more viable for peaking and power stability. Here’s how to evaluate the economics of an installation.
KEVIN MANTEL
Account Manager
Electric Power Gas Group
Michael Devine
Gas Marketing Consultant
North American Gas Segment
Abstract
Understand today’s forces that shape planning and decisions for utility providers in an ever-changing climate of regulation, disasters and extreme events, and modern fuel alternatives. Learn ways you can act now to monitor and dispatch power supply and join the power marketplace to capture new revenue opportunities. When planning for long term energy solutions, which can take years to implement, you may need to adopt interim energy solutions to meet your market’s needs. Whether you employ short-term or long-range solutions, the keys to success lie in planning now while developing a deep understanding of your current and future demand-capability projections.
This paper will introduce you to industry rubrics used to evaluate current and future power needs through strategic investments. Reliable and stable solutions are quite attainable once factors (strike prices, load-balancing, offsetting peak pricing), are calculated end-to-end.
Introduction
Many utilities are seeking cost-effective ways to keep up with the rising demand for power. Average yearly coal plant retirements in the United States between 2012 and 2021 as reported by utilities are 9,450 MW per year, with no new coal fired capacity having been announced for construction through the end of 2028 . Refueling some of these coal plants with natural gas or the addition of gas turbine generation has helped keep even with these retirements. Rapid increases in the number of renewable energy sources (wind, solar, etc.), local and federal mandates to incorporate these renewable resources into normal day to day utility operations, and historically low and intermittent renewable capacity factors adds more uncertainty to the utility operations.
Distributed Energy Resources (DER), power generated with reciprocating gas engines sited at utility or end user locations have been useful in helping utilities meet this rising demand for power. Using generated power at or near the point of production limits stress on distribution and transmission systems.
Natural-gas-fueled reciprocating engine-generators have served well in distributed generation service, delivering reliable power, ease of service, and low life-cycle cost. Natural gas is available in most parts of the country. Low natural gas prices in many areas make reciprocating engines even more attractive. When deployed for peaking support and other strategic purposes, they deliver high efficiency, increase the diversity of the power generating portfolio, protect power quality, and shield against market power price volatility. They also offer the potential for profitable heat recovery in combined heat and power configurations.
These factors can help utilities improve their financial position, differentiate their service to customers, retain and attract commercial and industrial users, and support community economic growth. Reciprocating gas generator sets can be sited at a utility owned facility or aggregated from local user sources to firm the locally generated, intermittent renewable power. The units can be used to provide power to firm the grid in the event of a local emergency, or simply be deployed to meet a growing peaking obligation. The key to using gas-fueled distributed generation is to deploy units strategically and dispatch them intelligently, with full understanding of market dynamics, daily and seasonal load profiles, and the relative costs of different generating resources.
Following the Market
Despite the economic slowdown that came with the recent Covid shutdowns, growth in electricity demand continues to outstrip supply, and utilities are challenged to meet that demand cost-effectively. Population shifts brought on during these periods have further aggravated the situation in many areas. Construction of new power plants and transmission lines impose huge costs, and often faces formidable social and political barriers. Distributed generation reduces or can help postpone required investments in the electrical distribution network, helping bridge the gap until more permanent utility solutions can be identified and permitted.
Gas engine-generators can be easily, quickly, and cost-effectively deployed at strategic points in the distribution system either at utility substations, in front of a customer meter, or behind the meter at a customer’s site, typically in return for electric rate incentives or for cost avoidance without limiting facility output during higher power cost periods. With the inherently low exhaust emissions with a new natural gas generator set, these gas units are permittable in most emission compliant areas, even where air-quality regulations are strict. Many natural gas generator set engines are designed to adapt for non-attainment zones, facilitating easier permitting in areas with very tight emission regulations.
The market factors favoring gas-fueled distributed generation largely boil down to two words: spark spread. The spark spread is the difference between the price received by a generator for electricity produced and the cost of the natural gas needed to produce that electricity. Spark spreads are calculated with the following equation:
Spark spread ($/MWh) = power price
($/MWh) – [natural gas price ($/MMBtu) *
heat rate (MMBtu/MWh)]
A key component of the spark spread equation is the heat rate, or measure of resource efficiency of the generating unit itself. A common measure of heat rate used today is 7,000 Btu/kWh. Though not included in the above calculation, all other costs (operation and maintenance, capital, and other financial costs) must be covered from the spark spread for the spread to be considered ‘positive’.
Based on cost per equivalent unit of energy, commercial natural gas prices in North America are significantly lower than electricity prices, and projections from the EIA show the gap increasing through 2030. (Figure 1).
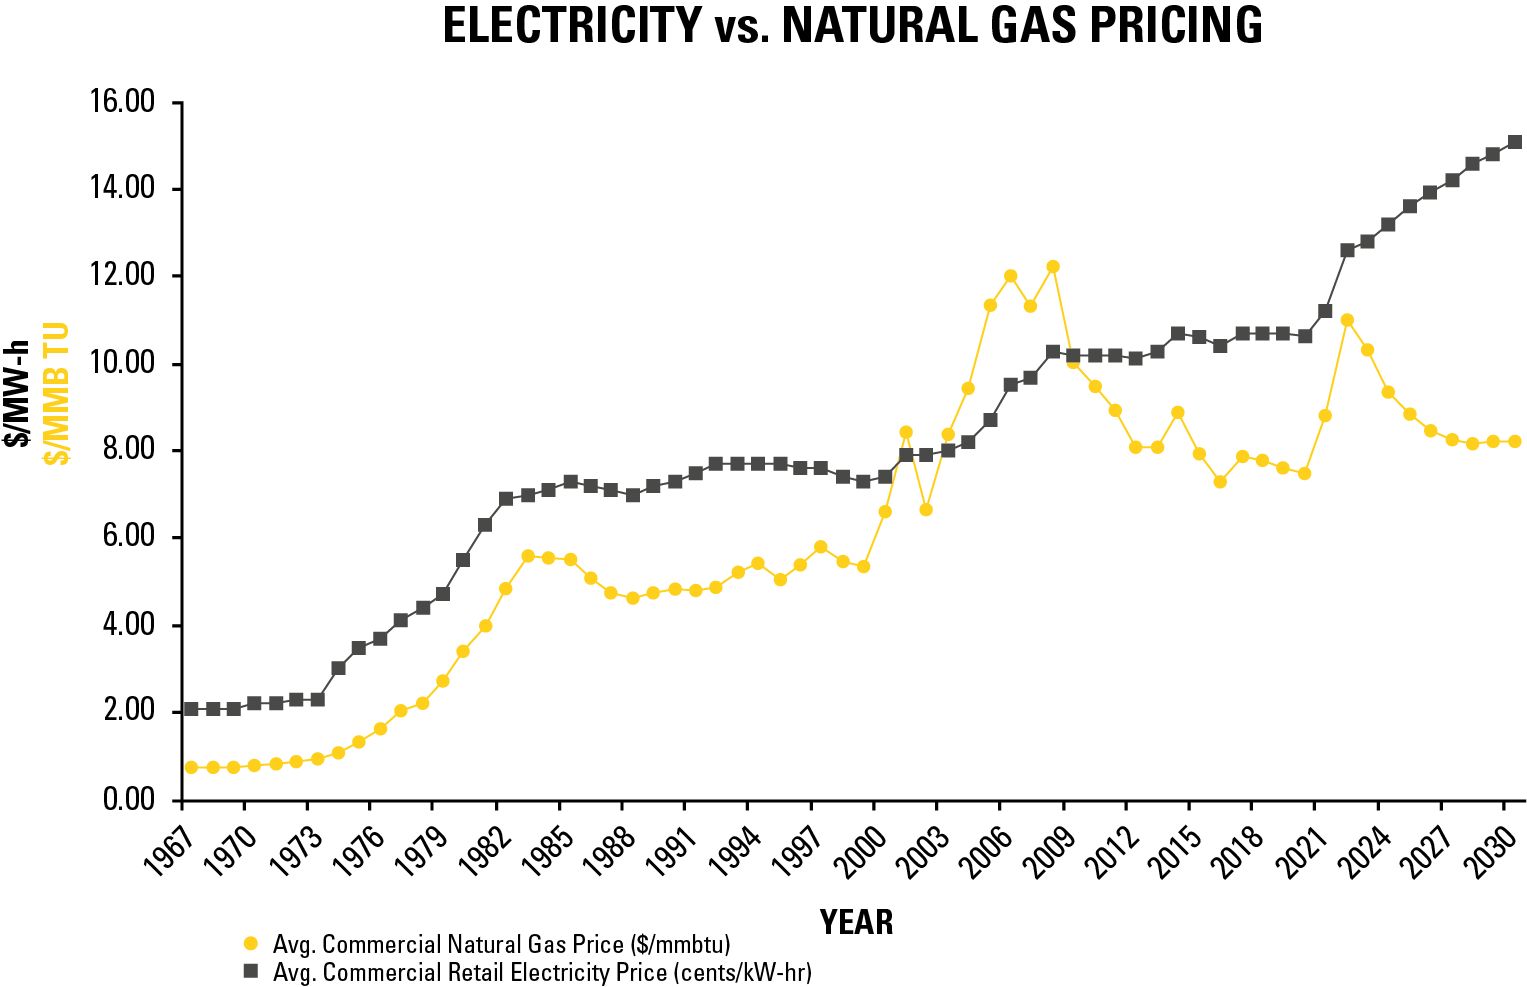
Figure 1: North America yearly average commercial electricity and gas prices (Source: EIA)
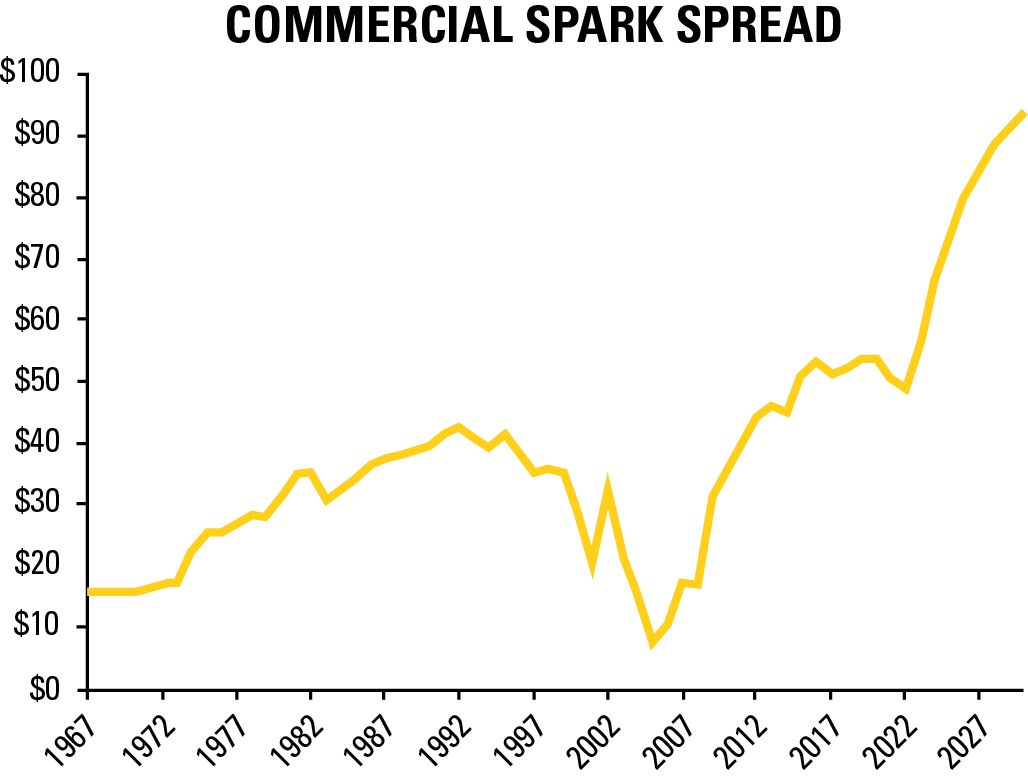
Figure 2: North America yearly average commercial spark spread
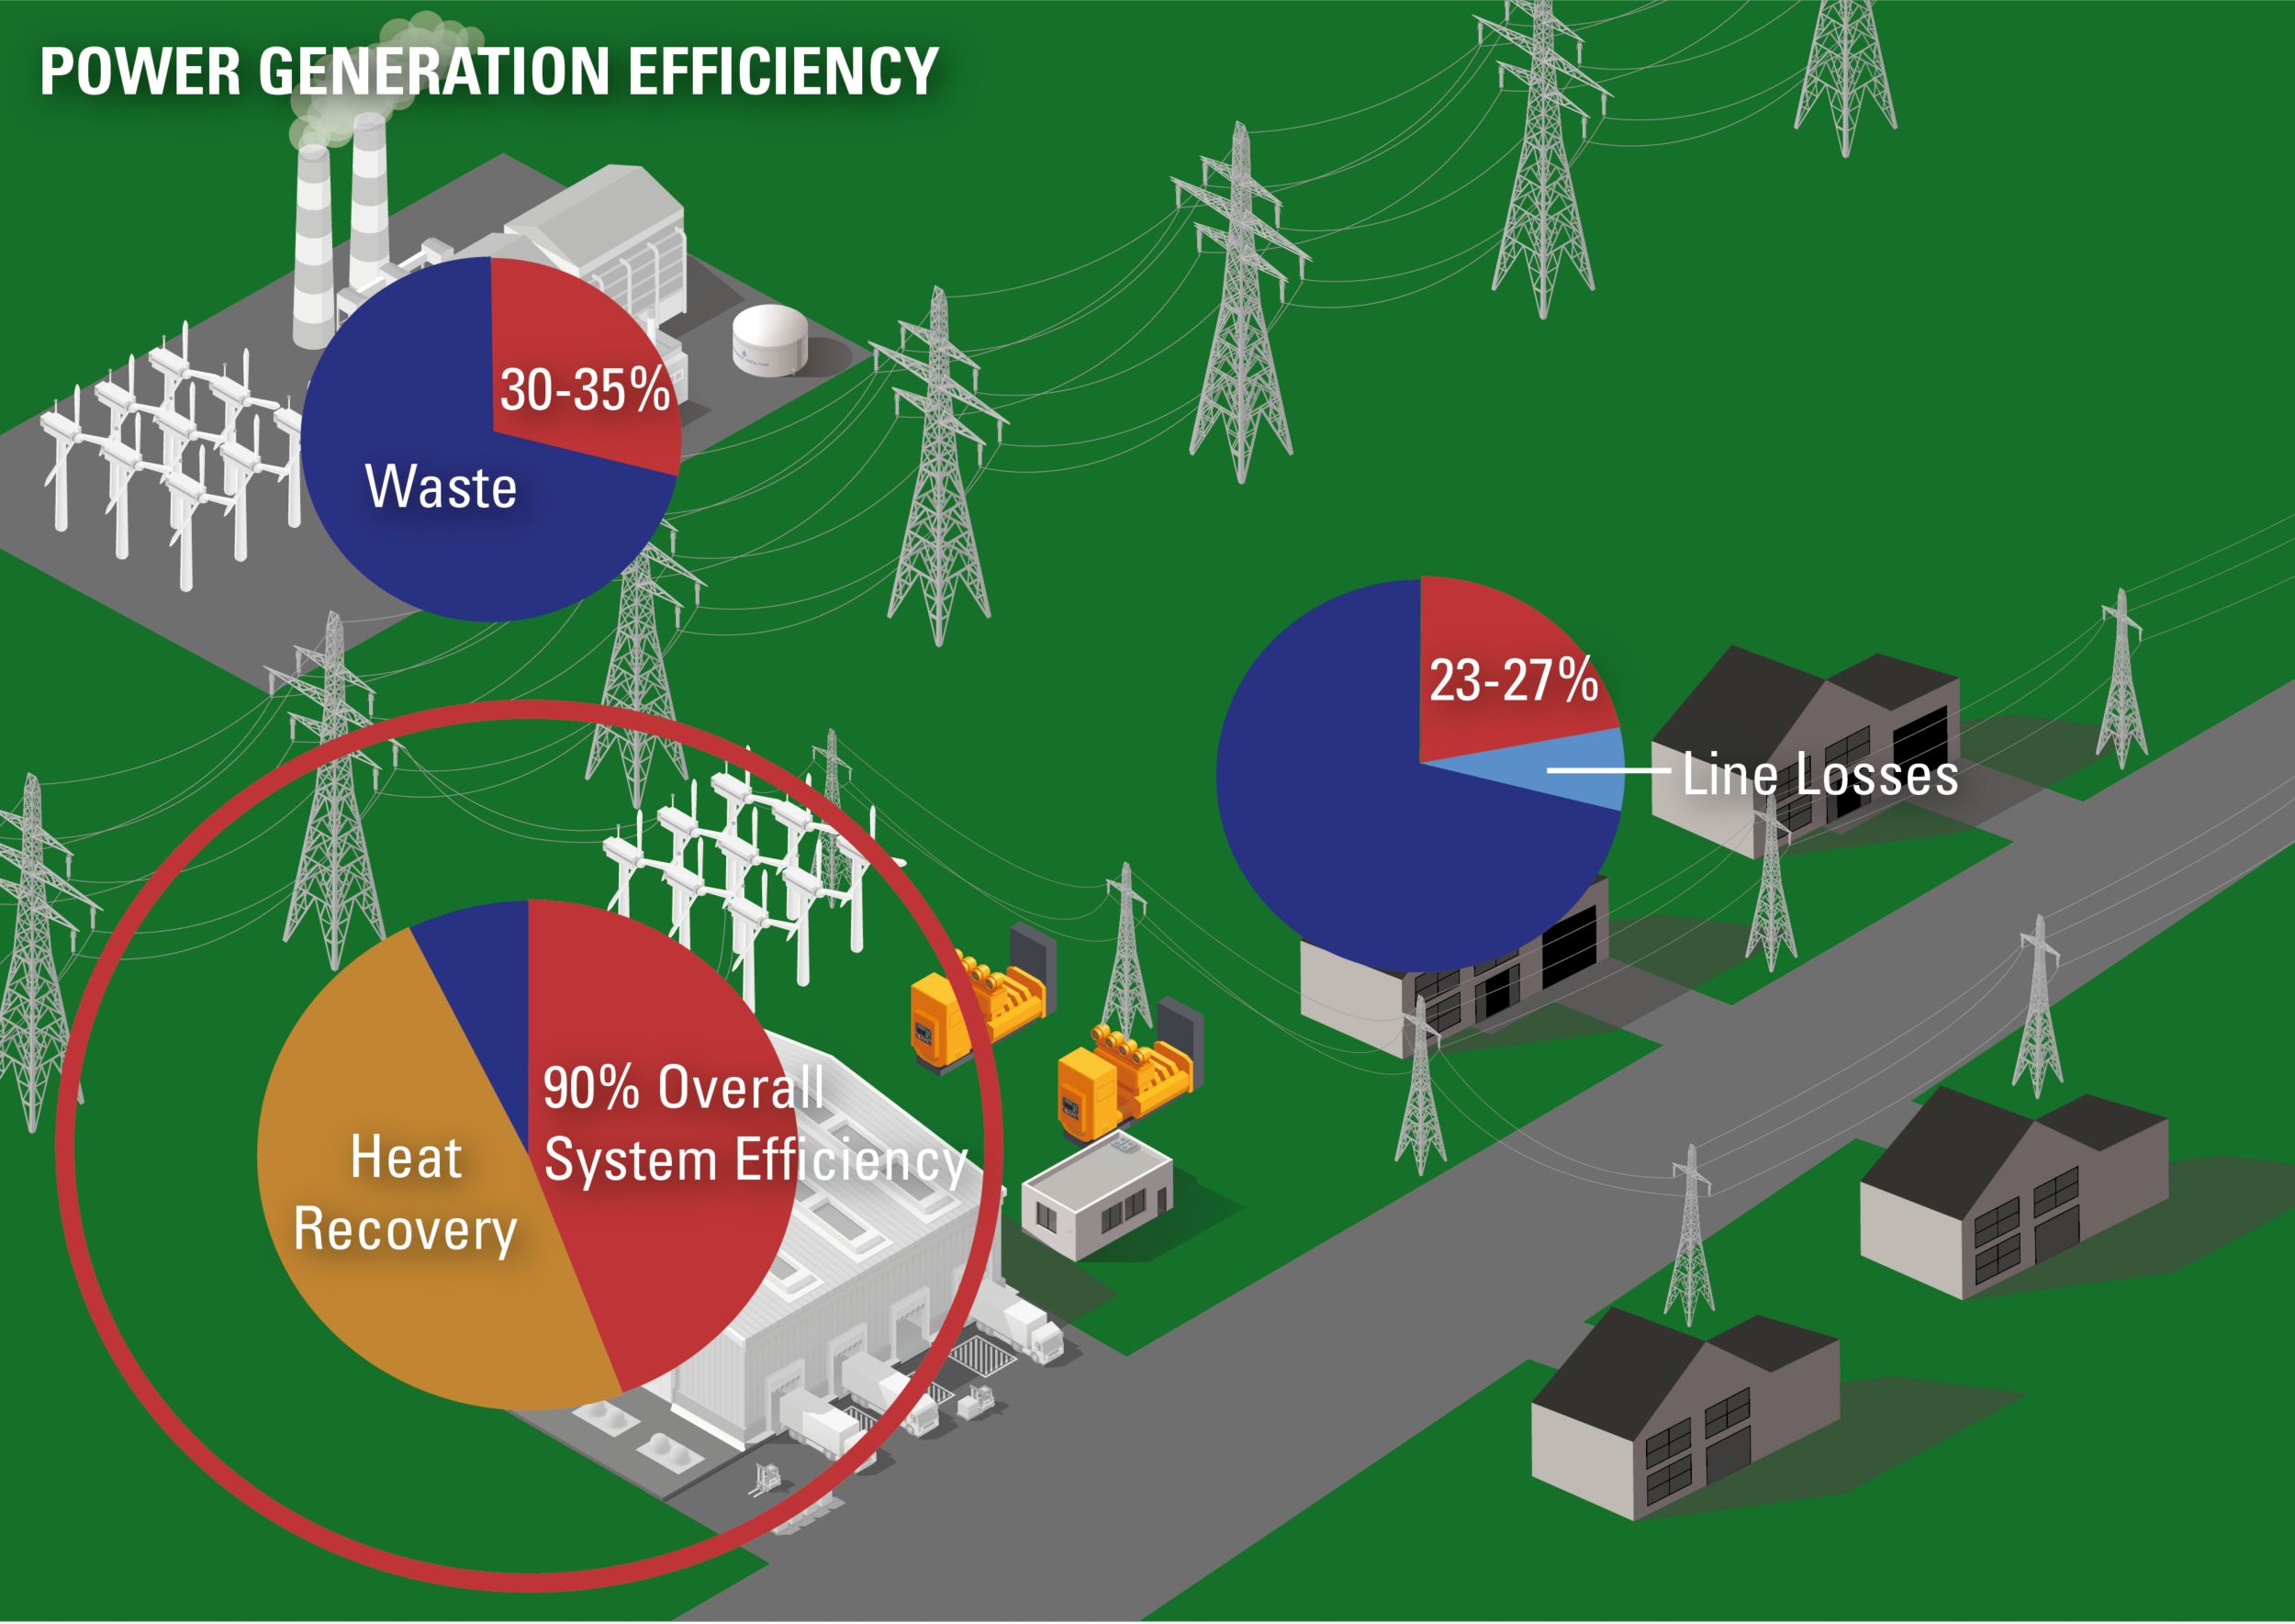
Figure 3: Electric Power Resource Efficiency
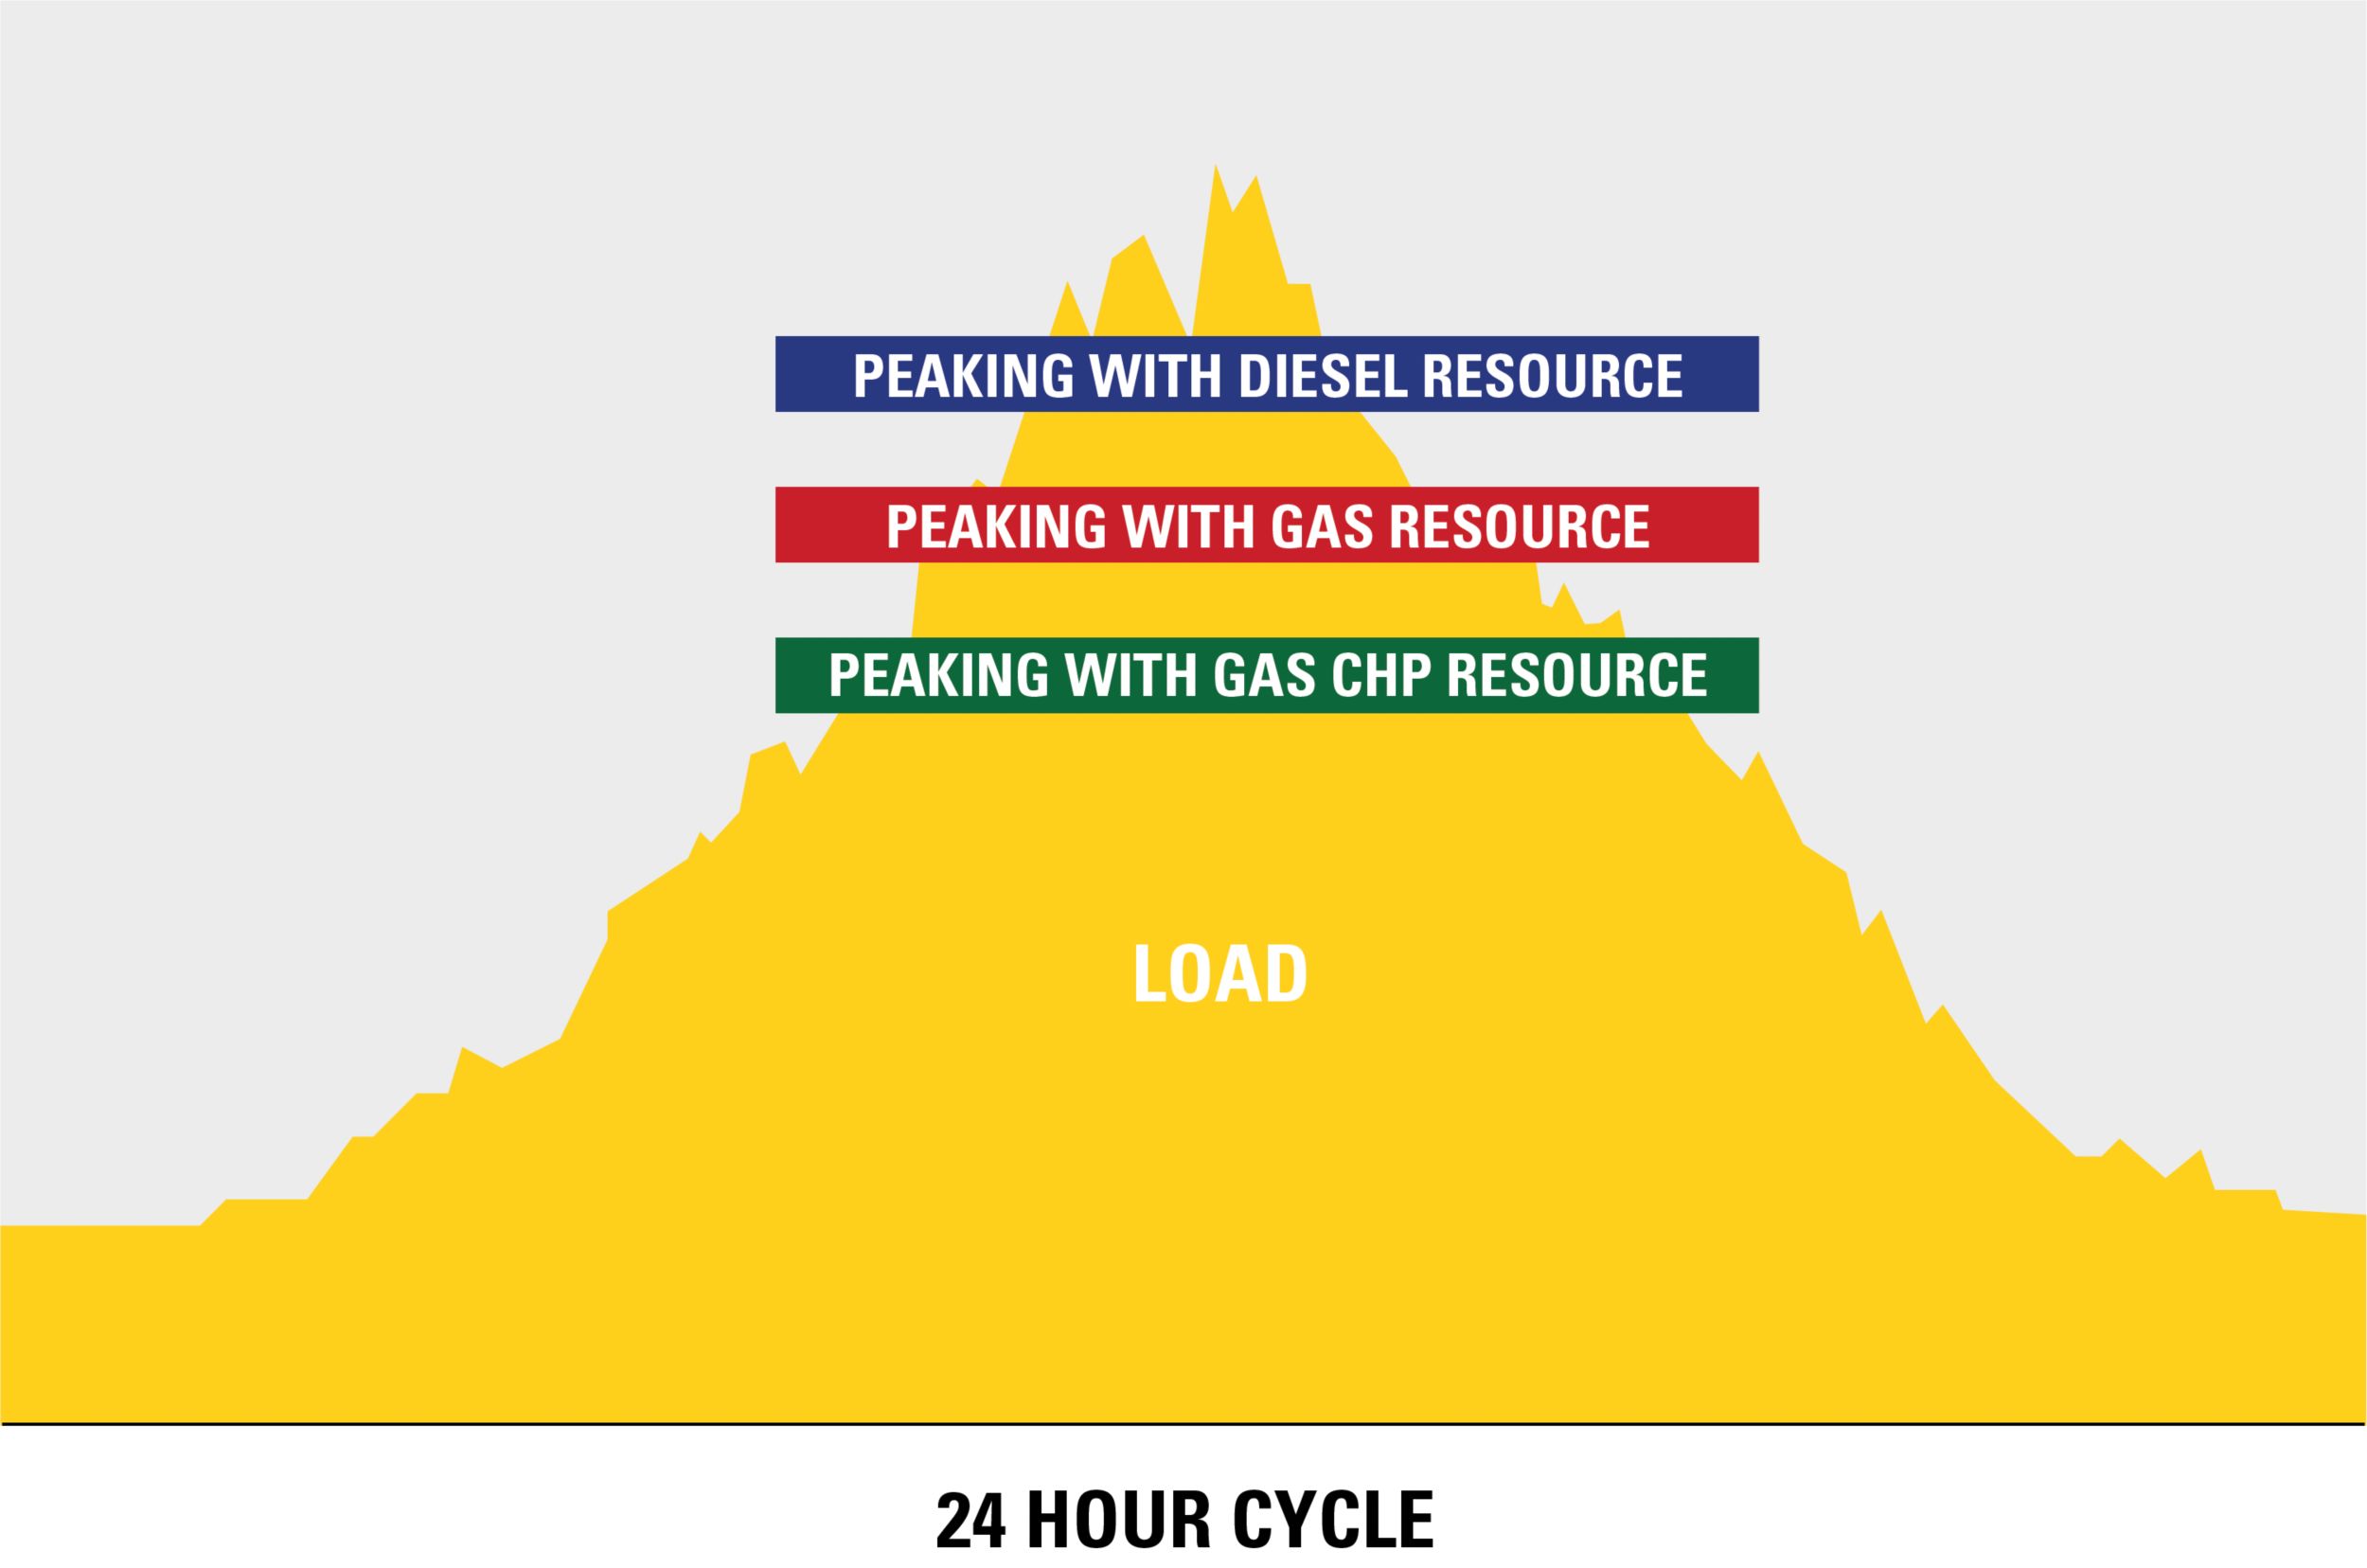
Figure 4: Peak Shaving Economics
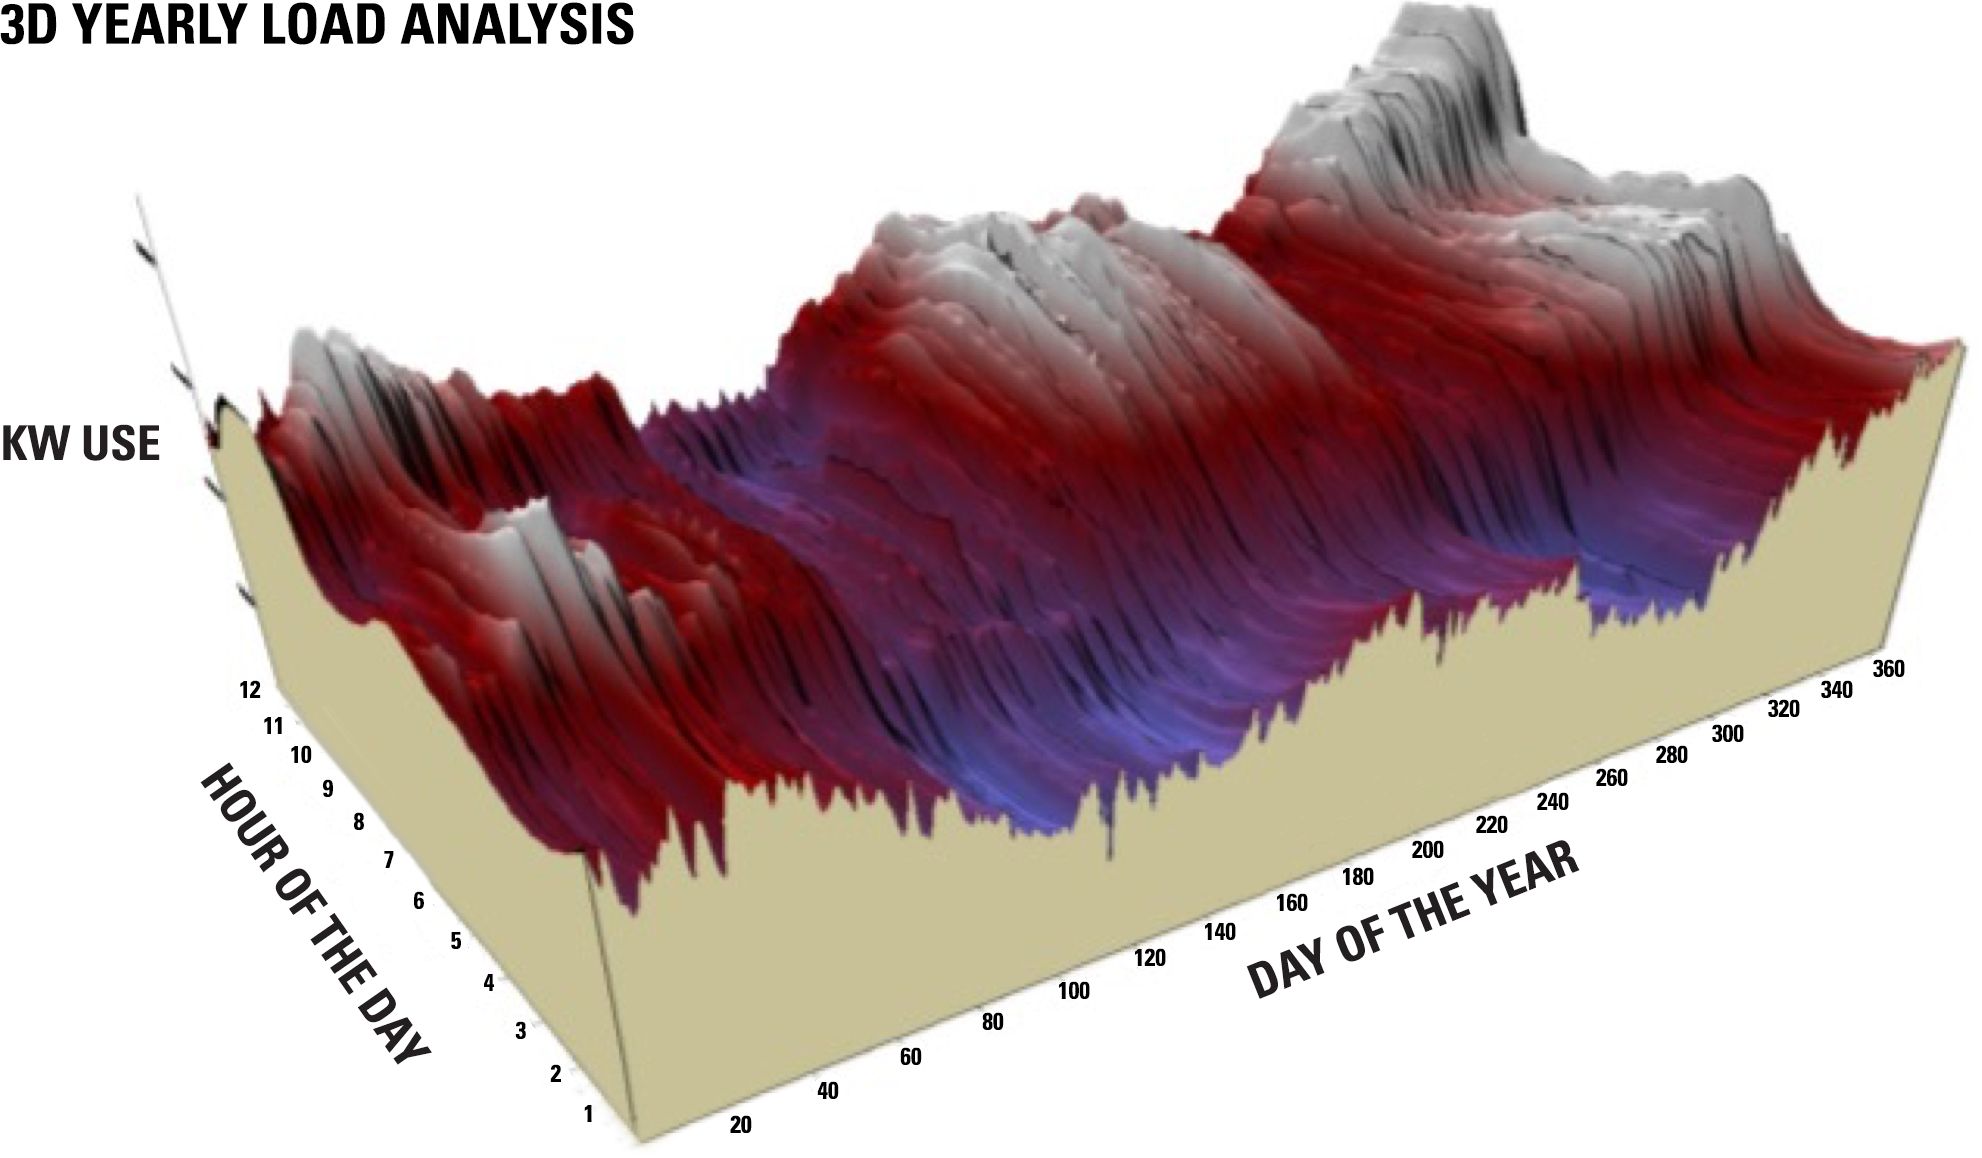
Figure 5: Annual Utility Load Profile Chart used with permission from Black Diamond Solutions Inc.
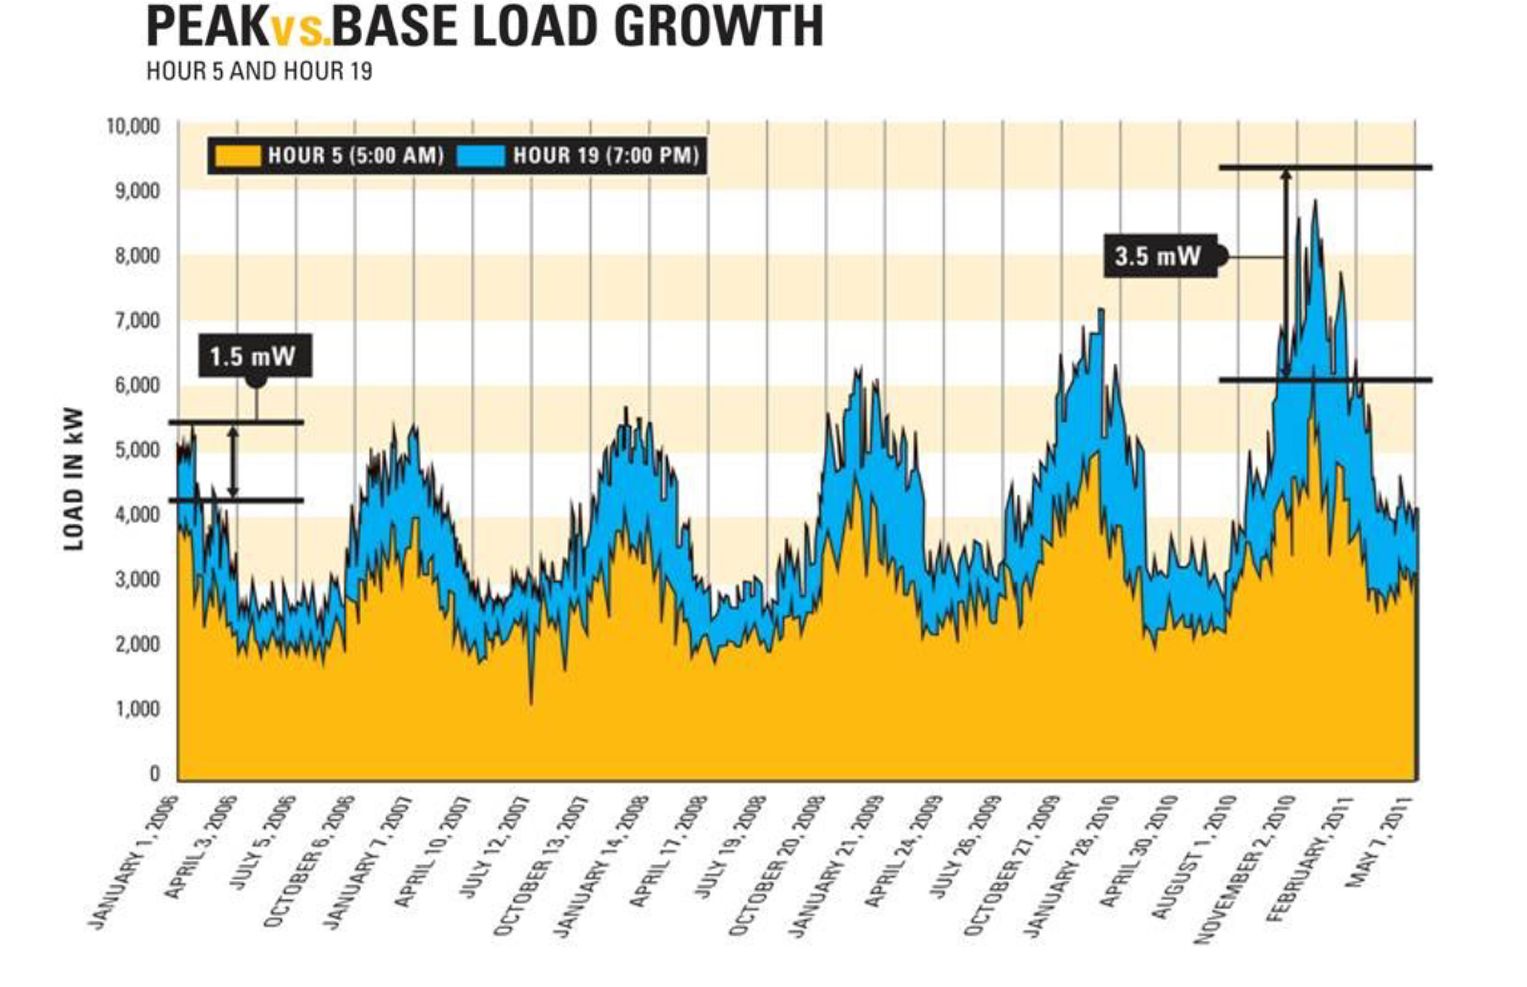
Figure 6: Peak vs. Base Load Growth Data for Chart provided by Black Diamond Solutions Inc.
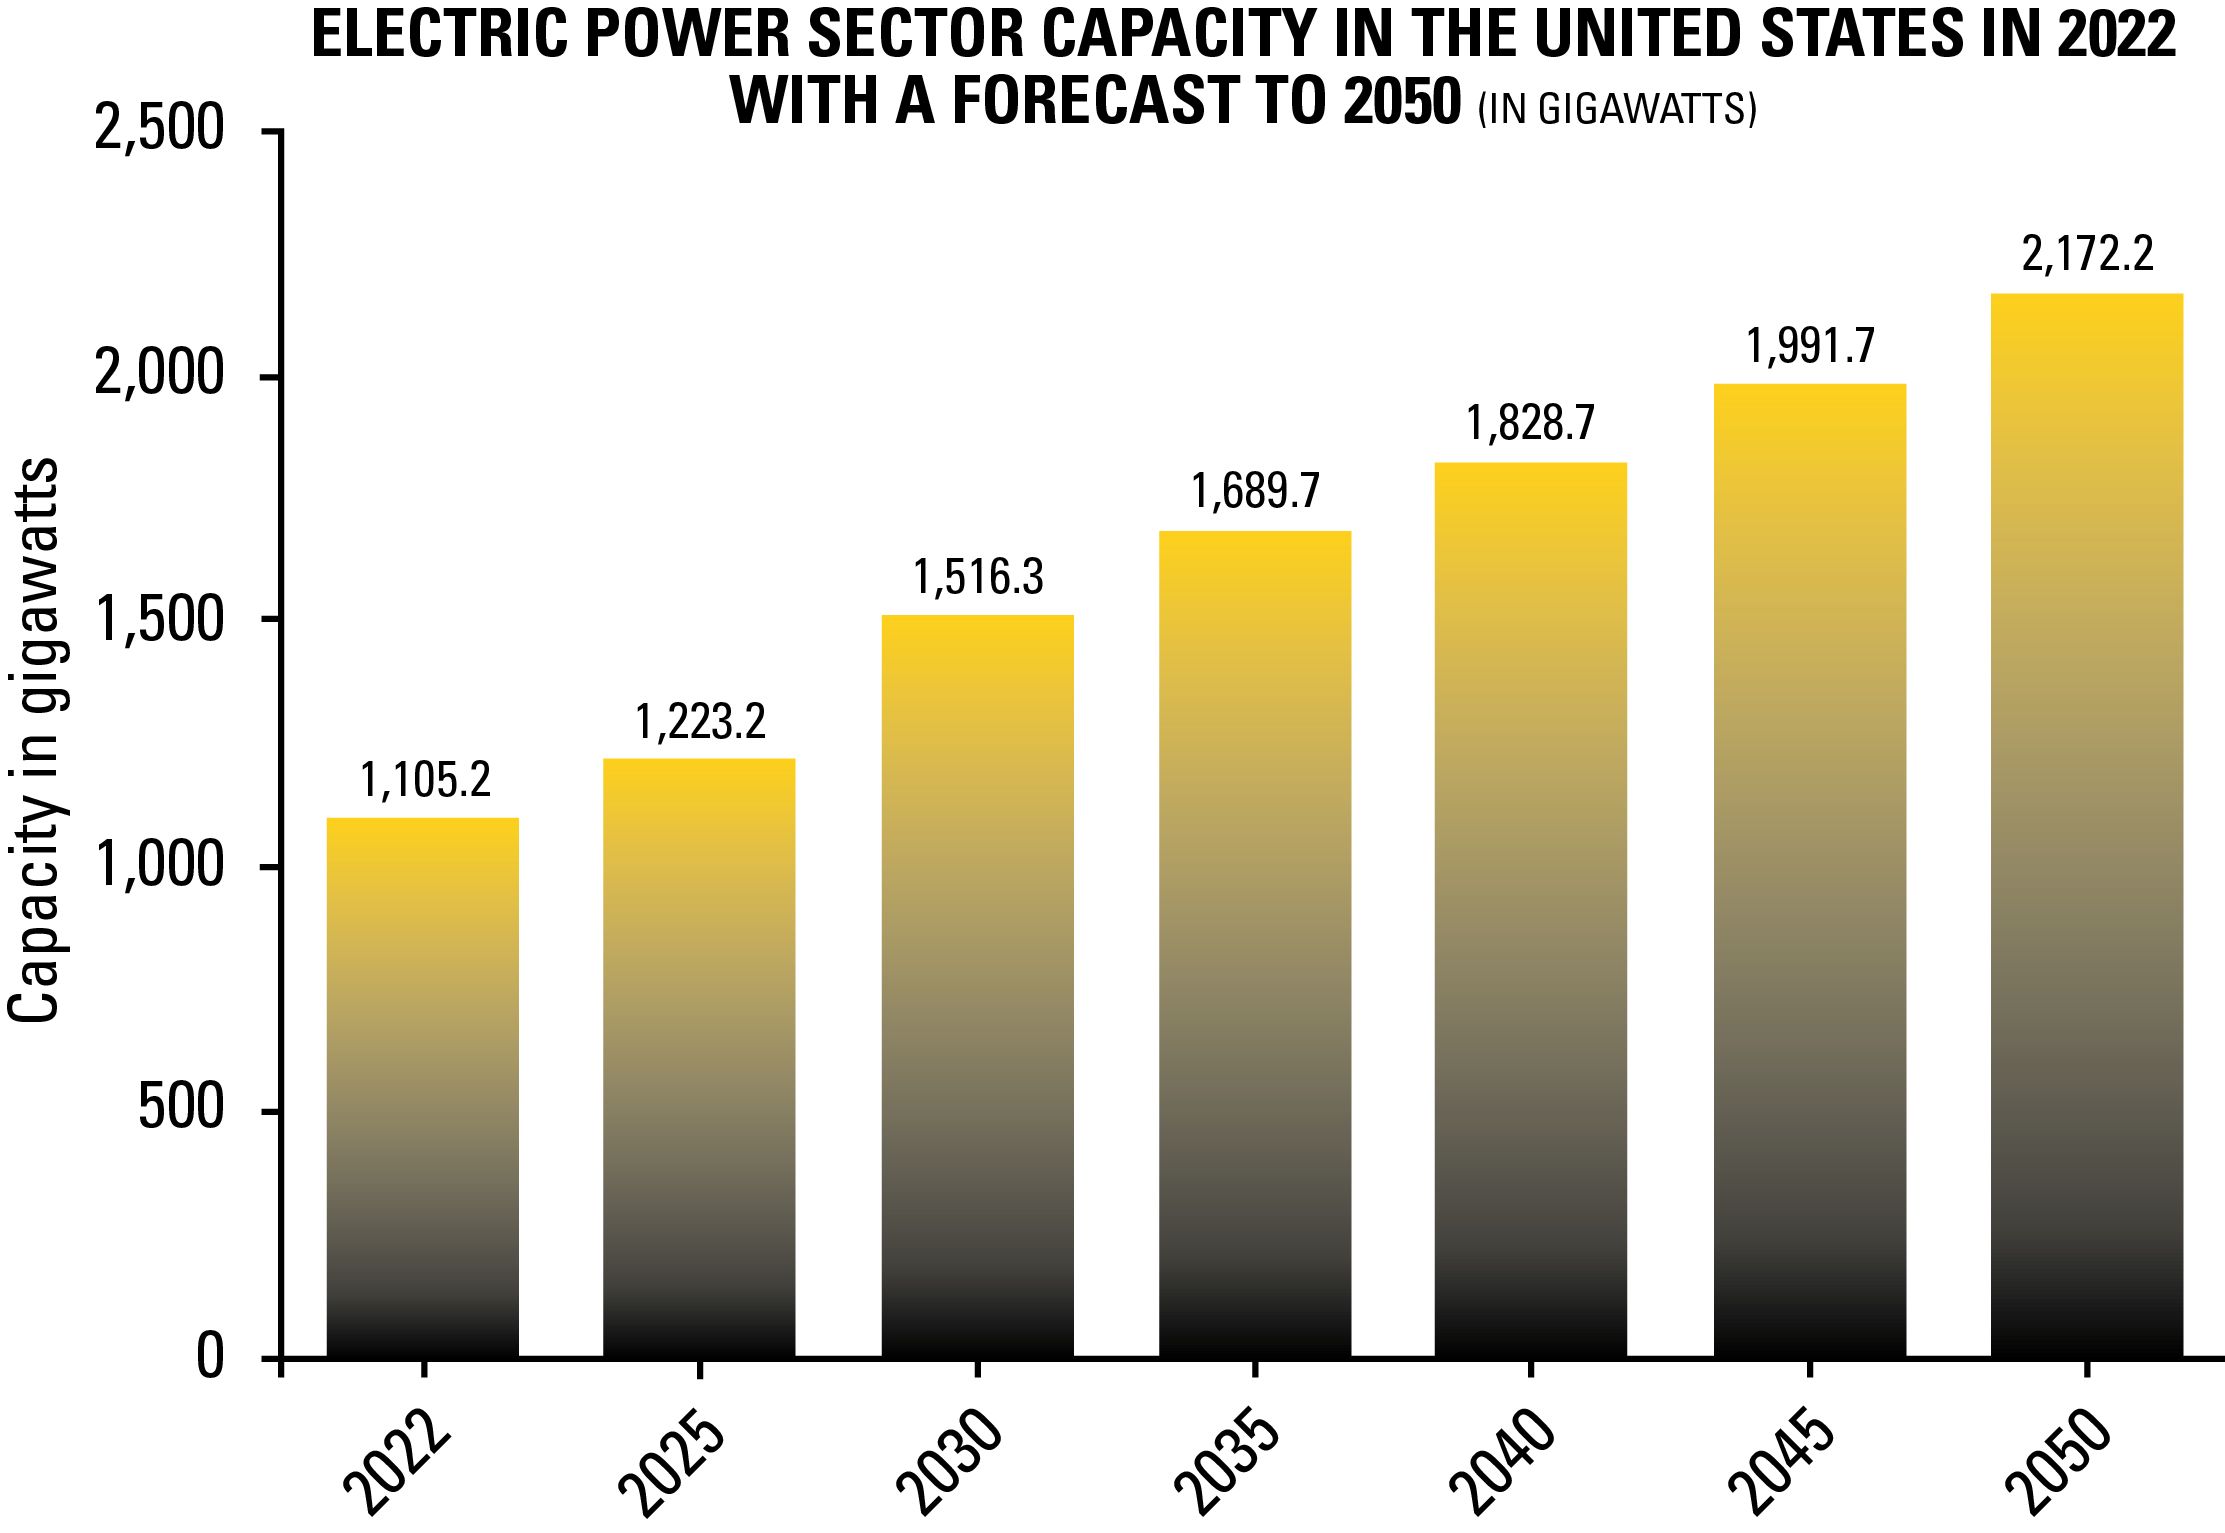
Figure 7: Electric power sector capacity in the United States in 2022 with a forecast to 2050 © Statista 2023
The main reason for the favorable gas prices is that shale gas production through hydraulic fracturing (fracking) has dramatically increased the supply. Increased supplies and lower gas production costs have had the effect of lowering the average wholesale natural gas prices in North America. Meanwhile, utility electricity prices have risen steadily and are projected to keep rising because of coal power plant retirements, the costs of transmission and distribution improvement, and other factors.
Based upon the yearly average commercial gas and electric prices seen in Figure 1, and a heat rate of 7,000 Btu/kWh, Figure 2 represents the historical and projected future spark spread.
Again, based upon the EIA forecasted commercial electric and gas pricing, the spark spread is expected to continue to widen positively, presenting a great financial benefit for utilities and users deploying gas fired generation technologies in distributed power applications.
Though spark spread is typically an important consideration when investing in a distributed generation system, it is not the only criteria to be used in many situations. Many facilities that need standby power to protect critical operations can justify the installed system expense simply by looking at potential cost savings in the event of a power outage. And many leverage installed power generation to meet their local or regional capacity needs. For these types of applications, the fact that the installed power can generate additional revenues when the spark spread is positive is simply an added financial benefit to their operation. It also gives the owner an opportunity to verify that the generator set will perform as designed under full load operating conditions, making sure that all systems will work properly when needed.
Attractive Technology
As distributed power resources, engine-generators are inherently more efficient than centralized power plants. For example, a coal-fired power plant is typically 30 to 35 percent efficient, and line losses in long-distance transmission and distribution can mean net efficiencies at the point of use as low as 23 to 27 percent.
By comparison, a gas engine or turbine installation will deliver 35 to 46 percent electrical efficiency (based on the fuel source and fuel low heating value), and line losses are minimal if the power is used nearby. Advances in engine combustion and control technology continue to produce incremental efficiency gains. Other virtues of gas-fueled engine generators include:
- Proven reliability – up to 98 percent uptime with proper maintenance.
- Low installed cost per kW and low operating cost per kWh.
- Flexibility to add capacity in affordable increments to accommodate growth (installations of multiple units up to 100 MW or more are fully feasible either aggregated or on one site where permitted).
- Fast installation and commissioning – as short as a few months for permanent installations and literally overnight with mobile packages for short-term needs, such as for emergencies or during central plant outages for repair or upgrade.
- Fast startup – when dispatched, non-emergency gaseous fueled units typically come online within 15 to 30 seconds. Gas generator sets used in dual distributed generation and standby service can be set up to meet the 10 second standby starting and loading requirements.
- Ability to match load demands – especially beneficial in peaking service and when used for standby service.
- Potential for heat recovery, boosting total resource efficiency to as much as 90 percent, or even higher as demonstrated in Figure 3.
- Easy access to service – trained technicians are globally available to service units with OEM parts.
Distributed units have clear benefits beyond pure economics. Placed wisely, they can help shore up reliability in key sectors of the distribution system and help the system maintain uniform voltage and waveform, providing voltage support and minimizing waveform distortion from other sources and improving power factor– both essential for customers operating sensitive electronic equipment and running precision manufacturing processes. Because they generate power at a predictable cost, they provide an effective hedge against volatile spot electric market prices.
When sited at customer facilities, distributed generation units also bring end users a source of standby power for an extra measure of reliability. That means a measure of insurance against process downtime, lost production, and their attendant costs. Benefits like these add significant value and can enable utilities to differentiate their services in what is otherwise a strictly price-driven commodity market. From a strengthened competitive position, utilities can more effectively retain major customers and attract new businesses and expansions to their territories.
The Growing Need for Gas
Applications for distributed units have evolved significant in recent years. Historically, diesel-fueled generators were used for distributed power, operating for as few as 100 to 500 hours per year to help carry the highest daily and seasonal peaks. More recently, as air-quality regulations have grown stricter and as diesel fuel prices have risen, gas-fueled units have become a preferred-fuel generating source. Their lower owning and operating costs per kWh make it economically advantageous when run for only a few hundred hours per year, or when run as continuous base-load units when market prices fluctuate.
Today, many gas engines are installed to handle peaking applications at end users’ sites. Once deployed, these same generator sets can serve as a standby engine in the event of a power outage. As the volume of renewable energy resources such as wind or solar become a bigger part of our energy portfolio, run hours will continue to grow to firm the intermittent renewable power source. With continued and growing popularity of microgrids, gas generator sets will play a major role in anchoring these systems as well.
For units hosted on customer sites, these extended hours can help justify investing in other equipment that recovers heat from engine exhaust and coolant. This heat can serve a host of purposes: building space and water heating, air conditioning (by way of absorption chillers), desiccant dehumidification, and heat or cooling (or both) for a host of industrial processes. Heat recovery in turn improves economics so that it becomes cost-effective to operate the systems for up to 4,000 annual hours – essentially half the year – or even more in distributed resource applications. Figure 4 is a representation of this improvement in power generation availability.
Assessing Loads and Costs
To define the optimum role for distributed generation, and to get the most value from it, it is essential to understand the dynamics of regional power markets and the utility’s current and projected load profiles. 3D load graphs can help managers easily visualize hourly and daily and adjust for seasonal load patterns. In Figure 5 - “Annual Utility Load Profile”, the X-axis represents day of year, the Y-axis represents the hour of the day, and the Z-axis represents the demand on the system (in MW).
This is a visualization of what events are happening on the system hour by hour, every day of the month, and every month of the year. Load patterns, most critically the peak load periods, become clear:
- Areas shaded blue represent periods of low usage – essentially base-load periods when the cost of energy is low.
- Areas shaded in red represent intermediate load periods. These loads are larger – usually 100 to 500 MW – and are typically fulfilled by large combustion turbines that run for relatively long periods at somewhat higher but still predictable operating cost.
- Areas shaded white represent the times of peak demand. In general, the higher the peak, the higher the per-kWh cost of energy. These are the periods in which distributed generation sources – like reciprocating engines – are most likely to come into play.
For a given utility, the timing and height of peaks depends on a variety of factors that include local climate and population patterns (e.g., seasonal versus year-round residency). Each utility, and often even regions within a utility service area, need to determine the load resources required to manage peaks.
Planning effectively means understanding not just today’s demands but the projected demands several years into the future. Figure 6 - “Peak vs. Base Load Growth” presents a load graph for a utility covering five years, in this example from 2006 through 2011. Comparing Hour 5 (during a low-demand period) to Hour 19 (during a peak period) shows a difference of 1.5 MW in 2006, but that difference increases to 3.5 MW by 2011. This indicates a peak load growing faster than the base load – an issue that needs to be addressed in resource planning.
Whether for immediate or future purposes, a key question is whether to meet peaks by generating power or purchasing it on the market. The answer depends on a careful analysis of the costs of each option.
On the purchased power side, the key parameter is the total delivered price of the power. For illustration, assume a block purchase of 5 MW of capacity, covering 365 days a year around the clock. Assuming an energy price of $55/MWh and a transmission charge of $6/MWh, the total cost is $61/MWh. But if some of that energy will ultimately go unused, the unit cost increases. For example, if only half of the energy is sold to customers, the cost doubles to $122/MWh. Of course, some of the energy can be sold back on the market, but likely not at the original purchase price. Assuming it is sold at $35/MWh, the net cost for the purchased energy is now $87/MWh. Of course, power for short-term peaks can be purchased on spot markets, but generally at much higher prices.
On the generation side, it is necessary to calculate the entire lifecycle cost per kW of the energy to be produced. This includes the installed cost of the unit and the facility to house it, plus the costs of fuel, operations, maintenance, periodic overhauls and repairs on the entire system. For the sake of comparison, the cost of power from a 2 MW gas-fueled generator set for intermediate and peak load service will range from $55 to $65/MWh, assuming a fuel price of $5/MMBtu.
Of course, the cost of purchased energy rises with the height of the peak on the load graph, while the cost of generation remains fixed. Therefore, as the load curve ascends, the cost advantage of gas-fueled generation increases. That value increases further if transmission constraints limit capacity to import purchased power from the grid.
Deploying Resources
In the simplest terms, a plan for deploying resources means analyzing a five-year demand projection, comparing the resources available to meet the need, and deciding how best to accommodate demand growth. The solution will most likely involve some combination of power purchases and power generation. Key questions to answer include:
- What power purchase agreements are in place and what are their durations? Upon their expiration, would another similar contract be available at a suitable price?
- What is the cost for transmission of the energy from the point of generation to the point of use?
- What generation resources are in place now? What are their individual and combined capacities?
In this analysis, it is essential to review the load profile projection and understand the daily and seasonal peaks. On the load graph in Figure 7, for example, red dots indicate periods when peak demand growth is greatest. One high-growth area is in the early morning hours where base load power probably can be purchased at an attractive price. Of more concern is the fast-growing peak between hours 15 and 20 during June, July, and August. There, demand is growing at peak times on the grid when energy is most expensive. This is the kind of peak that can lend itself well to on-site generation at a predictable cost with a resource such as gas-fueled reciprocating engines.
Resource planning includes assigning to each generation source a strike price – the cost per MWh to put the resource online. In general, a peaking resource would be dispatched anytime the cost of purchased power exceeds the strike price. In turn, the unit would be shut down when the purchased power cost falls below the strike price. For gas engine-generator sets, equipment dealers can provide a reliable estimate of the strike price based on the specific unit, local fuel price, altitude, ambient conditions, and other factors.
The next step is to stack resources from lowest to highest price – lowest-cost base load resources at the bottom and highest-cost peaking units at the top. Having multiple units available at different strike prices makes it possible to deliver power in the most cost-effective way in conformity with the actual load profile for any given hour or day. The idea is to find the mix of purchased power and self-generating resources that deliver customers the greatest energy security at the optimum cost.
Fulfilling Short-Term Needs
Gas engine-generator technology also can play a role in utility contingency or emergency planning: Contracted or rented gas-fueled power units are increasingly available. This model enables utilities to deploy reliable power wherever it is needed, whether to shore up a weak area on the grid, provide seasonal peaking capacity, or to respond to an emergency or natural disaster – all without the long-term costs of ownership and without carrying the assets on the balance sheet.
Mobile rentals are a fast and easy solution. Units in capacities to 2 MW or larger can be deployed on utility-owner or customer sites for easy permitting. Installation is extremely fast – multiple units with combined capacity of 50 MW or more can be delivered and connected in seven days, versus seven months for a permanent gas turbine power station.
Units come ready-to-deploy as complete packages with grid paralleling controls, protective relays, circuit breakers, cooling systems, sound-attenuated enclosures, exhaust silencers, and emissions control devices as required.
A variety of financing models are available, including complete monthly or full-rental-term pricing that incorporates scheduled and unscheduled maintenance, technical support and repairs. Ancillary equipment and services can be included. Rental units can be reserved through equipment dealers under a contingency planning model where the utility receives the right of first refusal for access to equipment in case of catastrophic events.
Reliable and Economical Technology
Advancing technology makes reciprocating engine-generator sets more appealing as distributed resources. The latest units develop high power output in footprints up to 50 percent smaller than in the past, fitting easily in small engine rooms or in containerized power plants. They use a variety of digital microprocessor-based monitoring and control technologies that improve power density, fuel consumption and, most importantly, reliability. Low-pressure fuel systems (0.5 to 5 psi (0.35-35 kPa)) eliminate the need for fuel compression skids, allowing these power systems to be eligible for installation in manned facilities.
In more recent years, an alternative approach to engine selection has emerged. Instead of users purchasing units off the shelf, a manufacturer customizes the equipment to fit the specific application. In this model, the user provides a sample of the fuel, describes the site ambient conditions and altitude, and specifies the application and key operating objectives (top fuel economy, lowest emissions, block loading capability, and others). The manufacturer then designs a gas engine-generator system to fit those criteria.
The customized units come with further advances in engine technology that expand the limits of engine control and reach new heights of efficiency – up to 46 percent electrical efficiency in generator sets alone and up to 90 percent total plant efficiency in combined heat and power service.
EXTENDED MAINTENANCE INTERVALS
Intervals for spark plug replacement and oil changes can reach 4,000 hours – equivalent to six months of continuous operation, or more than double the interval expected with traditional technology. It is common for cylinder head overhaul intervals to reach 32,000 hours, and major overhaul intervals 64,000 to 80,000 hours. The expense is further reduced by lowering oil consumption by as much as half, a savings of 500 gallons (1,892 Liters), which translates to $10,000 per year on a 20-cylinder engine-generator rated at 2 MW. Local technicians can fully maintain these units through customized maintenance programs.
CONCLUSION
Today’s utility operations can benefit greatly from the flexibility to deploy distributed generating resources. Natural-gas-fueled generator sets can fulfill that role admirably. When deployed strategically, they provide economic and reliability benefits to the utility and customers alike, while enabling utilities to differentiate their services and gain a stronger position in competitive markets.
About the Author
Kevin Mantel is Account Manager with the Electric Power Gas Group of Caterpillar Inc., based in Lafayette, Ind. He can be reached at Mantel_Kevin@cat.com
About Caterpillar
For more than 95 years, Caterpillar Inc. has been making progress possible and driving positive and sustainable change on every continent. With 2022 sales and revenues of $59.4 billion, Caterpillar is a technology leader and the world’s leading manufacturer of construction and mining equipment, clean diesel and natural gas engines and industrial gas turbines.